The Problem
You’ve built a beautiful canvas app backed by Dataverse. Your users can filter, sort, and search records perfectly.
Then someone asks:
“Can I export what I see to Excel?”
Unlike Model-Driven Apps, canvas apps don’t have a built-in Export to Excel button. You need to build this yourself.
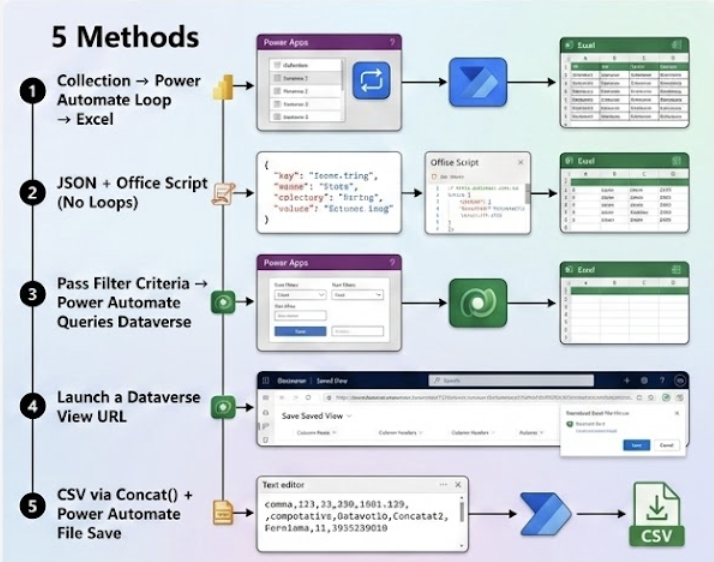
In this guide, we’ll walk through 5 different methods — each with step-by-step instructions, honest pros, and honest cons.
Before We Start
Every method in this guide assumes:
- Your data lives in Dataverse tables
- Your gallery already has filters and sorting applied
- Your gallery’s
Itemsproperty looks something like this:
SortByColumns(
    Filter(
        Accounts,
        Status = drpStatus.Selected.Value,
        StartsWith(Name, txtSearch.Text)
    ),
    "revenue",
    If(SortDescending, SortOrder.Descending, SortOrder.Ascending)
)
Let’s dive in! 🚀
Method 1: Collection → Power Automate Loop → Excel
This is the most common approach you’ll find online. Collect your filtered records, send them as JSON, and use Power Automate to write each row into an Excel table.
Step 1: Collect the Filtered Records
Add an Export button to your screen. Set its OnSelect to:
ClearCollect(
    colExportData,
    ForAll(
        Gallery1.AllItems,
        {
            AccountName: ThisRecord.Name,
            Revenue: ThisRecord.Revenue,
            Status: ThisRecord.Status,
            City: ThisRecord.Address1_City
        }
    )
);
Why ForAll? It captures exactly what the user sees and flattens lookups/choices into simple text values.
Step 2: Convert to JSON
Add this after the ClearCollect:
Set(varJSONExport, JSON(colExportData, JSONFormat.IndentFour));
Step 3: Create the Power Automate Flow
- Go to Power Automate → Create → Instant cloud flow
- Set the trigger to PowerApps (V2)
- Add an input of type Text called
ExportJSON - Add a Parse JSON action
- Content:
triggerBody()['text'] - Schema: Generate from a sample JSON array of your columns
- Content:
- Add an Apply to each loop over the parsed JSON body
- Inside the loop add Excel Online (Business) → Add a row into a table
- Point to a pre-created Excel file in SharePoint
- Map each column to the parsed JSON fields
- Add a Respond to a PowerApp or flow action returning the file URL
Step 4: Call the Flow from Power Apps
Set(varFileURL, ExportToExcelFlow.Run(varJSONExport));
Launch(varFileURL);
Notify("Export complete!", NotificationType.Success);
Step 5: Pre-Create the Excel Template
- Go to your SharePoint document library
- Create a blank
.xlsxfile - Add a Table with headers matching your columns — Account Name, Revenue, Status, City
- Save the file — the flow will append rows to this table
Pros
- ✅ Exports exactly what the user sees
- ✅ Full control over which columns are exported
- ✅ Works with complex filter logic
- ✅ User-triggered and intuitive
Cons
- ❌
Apply to eachis painfully slow for 500+ rows - ❌ JSON payload from Power Apps has a ~2 MB limit
- ❌ Requires a Power Automate license
- ❌ Excel template must be pre-created with correct headers
Method 2: JSON + Office Script (No Loops)
This method eliminates the slow loop from Method 1. Instead of writing row-by-row, an Office Script writes all rows at once.
Step 1: Collect and Convert to JSON
Same as Method 1 Steps 1 and 2:
ClearCollect(
    colExportData,
    ForAll(
        Gallery1.AllItems,
        {
            AccountName: ThisRecord.Name,
            Revenue: ThisRecord.Revenue,
            Status: ThisRecord.Status
        }
    )
);
Set(varJSON, JSON(colExportData, JSONFormat.IndentFour));
Step 2: Create the Office Script
In Excel Online, go to Automate → New Script and paste:
function main(workbook: ExcelScript.Workbook, jsonData: string) {
    let data: Array<{
        AccountName: string;
        Revenue: number;
        Status: string;
    }> = JSON.parse(jsonData);

    let sheet = workbook.getActiveWorksheet();

    // Clear previous data
    sheet.getUsedRange()?.clear();

    // Write headers
    let headers = ["Account Name", "Revenue", "Status"];
    sheet.getRangeByIndexes(0, 0, 1, headers.length)
         .setValues([headers]);

    // Write ALL rows at once
    let rows = data.map((item) => [
        item.AccountName,
        item.Revenue,
        item.Status
    ]);

    if (rows.length > 0) {
        sheet.getRangeByIndexes(1, 0, rows.length, headers.length)
             .setValues(rows);
    }

    // Format as table
    let range = sheet.getRangeByIndexes(
        0, 0, rows.length + 1, headers.length
    );
    sheet.addTable(range, true);
}
Save the script.
Step 3: Build the Power Automate Flow
- Trigger: PowerApps (V2) → Input:
ExportJSON(Text) - Add a Run script action (Excel Online Business)
- Location: Your SharePoint site
- Document Library: Select the library
- File: Select your Excel workbook
- Script: Select the script you created
- ScriptParameters/jsonData:
triggerBody()['text']
- Add a Respond to a PowerApp or flow action returning the file URL
Step 4: Call the Flow
Set(varFileURL, ExportViaOfficeScript.Run(varJSON));
Launch(varFileURL);
Pros
- ✅ Much faster than Method 1 — all rows written at once
- ✅ Clean Excel output with formatted table
- ✅ Can handle 2,000–5,000 rows comfortably
- ✅ No slow
Apply to eachloops
Cons
- ❌ Requires Office Scripts (needs Microsoft 365 Business Standard or higher)
- ❌ Still subject to the ~2 MB JSON payload limit
- ❌ Office Scripts not available in all tenants (GCC, etc.)
- ❌ Slightly more complex setup
Method 3: Pass Filter Criteria → Power Automate Queries Dataverse
Instead of sending data to the flow, you send filter criteria. Power Automate queries Dataverse directly, completely bypassing the 2,000-row delegation limit.
Step 1: Capture the User’s Filter Selections
// On drpStatus.OnChange
Set(varFilterStatus, drpStatus.Selected.Value);

// On sort toggle
Set(varSortColumn, "revenue");
Set(varSortOrder, "desc");
Step 2: Create the Power Automate Flow
Trigger: PowerApps (V2) with these inputs:
FilterStatus(Text)SortColumn(Text)SortOrder(Text)SearchText(Text)
Add a List rows action (Dataverse):
- Table: Accounts
- Filter rows:
statuscode eq '@{triggerBody()['text_1']}' and startswith(name, '@{triggerBody()['text_4']}')- Sort by:
@{triggerBody()['text_2']} @{triggerBody()['text_3']}- Row count: 5000
Add a Create CSV table action (Data Operations):
- From:
valueoutput of the List rows action - Columns: Custom — map only the columns you need
- From:
Add a Create file action (SharePoint):
- File Name:
Export_@{utcNow()}.csv - File Content: Output of Create CSV table
- File Name:
(Optional) Add a Convert file action (OneDrive for Business):
- Convert the
.csvto.xlsxif needed
- Convert the
Add a Respond to a PowerApp or flow action → Return the file URL
Step 3: Call the Flow from Power Apps
Set(
    varExportLink,
    ExportFromDataverse.Run(
        varFilterStatus,
        varSortColumn,
        varSortOrder,
        txtSearch.Text
    )
);
Launch(varExportLink);
Notify("Your export is ready!", NotificationType.Success);
Pros
- ✅ No delegation limits — Power Automate queries Dataverse server-side
- ✅ Can handle tens of thousands of rows
- ✅ No large payloads sent from Power Apps
- ✅ Fast execution
Cons
- ❌ Must rebuild filter logic as OData — can drift from app logic
- ❌ Complex filters (nested OR/AND) are harder in OData
- ❌ Sorting on lookup fields is tricky
- ❌ User waits 15–60 seconds for the flow to complete
Method 4: Launch a Dataverse View URL
If your Dataverse table has saved views that match common filter combinations, you can skip Power Automate entirely and launch the built-in export.
Step 1: Create a Saved View in Dataverse
- Go to make.powerapps.com
- Navigate to Tables → Open your table
- Click Views → + New view
- Add the columns you want
- Apply your filters
- Save the view
- Copy the View ID from the URL
Step 2: Construct the Export URL
Dataverse supports a direct export URL pattern:
https://{org}.crm.dynamics.com/_grid/print/export_to_excel.aspx?entity={table_logical_name}&viewid={view_guid}&viewtype=1039
Step 3: Add a Launch Button in Power Apps
Launch(
    "https://yourorg.crm.dynamics.com/" &
    "_grid/print/export_to_excel.aspx?" &
    "entity=account&" &
    "viewid=%7bYOUR-VIEW-GUID%7d&" &
    "viewtype=1039",
    {},
    LaunchTarget.New
)
Step 4: (Optional) Switch Views Dynamically
If you pre-create multiple views for common filter states:
Launch(
    "https://yourorg.crm.dynamics.com/" &
    "_grid/print/export_to_excel.aspx?" &
    "entity=account&viewid=" &
    If(
        drpStatus.Selected.Value = "Active",
        "%7bACTIVE-VIEW-GUID%7d",
        "%7bINACTIVE-VIEW-GUID%7d"
    ) &
    "&viewtype=1039",
    {},
    LaunchTarget.New
)
Pros
- ✅ Zero Power Automate needed — no premium license required
- ✅ Very simple to implement
- ✅ Handles large datasets natively
- ✅ Produces a proper
.xlsxfile
Cons
- ❌ Filters are static — tied to pre-created views
- ❌ Not “what you see is what you export”
- ❌ User needs Dataverse/Dynamics license with view access
- ❌ URL format can break with platform updates
- ❌ Limited to the views you pre-create
Method 5: CSV via Concat() + Power Automate File Save
This is the lightest-weight method. Build the entire CSV string in Power Apps using Concat(), then send it to a dead-simple flow that saves it as a file.
Step 1: Build the CSV String
On your Export button’s OnSelect:
Set(
    varCSV,
    "Account Name,Revenue,Status,City" & Char(13) & Char(10) &
    Concat(
        SortByColumns(
            Filter(
                Accounts,
                Status = drpStatus.Selected.Value,
                StartsWith(Name, txtSearch.Text)
            ),
            "revenue",
            If(
                SortDescending,
                SortOrder.Descending,
                SortOrder.Ascending
            )
        ),
        """" & Name & """" & "," &
        Text(Revenue) & "," &
        """" & Text(Status) & """" & "," &
        """" & Address1_City & """",
        Char(13) & Char(10)
    )
);
Important: Wrap text values in escaped double quotes (
"""") to handle commas inside field values.
Step 2: Create a Simple Flow
- Trigger: PowerApps (V2) → Input:
CSVContent(Text) - Add a Create file action (SharePoint):
- Folder Path:
/Shared Documents/Exports - File Name:
Export_@{utcNow()}.csv - File Content:
triggerBody()['text']
- Folder Path:
- (Optional) Add a Convert file action (OneDrive):
- Convert
.csv→.xlsx
- Convert
- Add a Respond to a PowerApp or flow action → Return the file URL
Step 3: Call the Flow and Open the File
Set(varFileLink, SaveCSVFlow.Run(varCSV));
Launch(varFileLink);
Notify("Export complete!", NotificationType.Success);
Pros
- ✅ Simplest flow — no loops, no scripts, no parsing
- ✅ Exports exactly what the user sees
- ✅ Fast for small-to-medium datasets
- ✅ Low licensing requirements
Cons
- ❌
Concat()is subject to delegation limits (max 2,000 rows) - ❌ CSV string limited to ~2 MB
- ❌ Must handle special characters manually
- ❌ Produces
.csv, not native.xlsx(without conversion step) - ❌ Complex column types need manual formatting
Comparison Table
| Criteria | Method 1 Collection + Loop | Method 2 JSON + Office Script | Method 3 OData in Flow | Method 4 Launch View URL | Method 5 CSV Concat |
|---|---|---|---|---|---|
| Approach | Collect filtered records → Send JSON → Flow loops and writes each row to Excel | Collect filtered records → Send JSON → Office Script writes all rows at once | Send filter criteria → Flow queries Dataverse → Creates CSV/Excel | Launch a pre-built Dataverse view export URL directly | Build CSV string with Concat() → Flow saves as file |
| Max Rows | ~2,000 | ~5,000 | 100,000+ | Unlimited | ~2,000 |
| Speed | 🐢 Slow (row-by-row loop) | 🐇 Fast (bulk write) | 🐇 Fast (server-side query) | ⚡ Instant (native platform export) | 🐇 Fast (single string, no loop) |
| Matches User's Filters | ✅ Exact match | ✅ Exact match | ⚠️ Must rebuild as OData | ❌ Static views only | ✅ Exact match |
| Complexity | 🟡 Medium | 🔴 High | 🟠 Medium-High | 🟢 Low | 🟢 Low |
| Delegation Safe | ❌ No (client-side limit) | ❌ No (client-side limit) | ✅ Yes (server-side query) | ✅ Yes (platform handles it) | ❌ No (client-side limit) |
| Output Format | .xlsx | .xlsx | .csv / .xlsx | .xlsx | .csv |
| Licensing Needed | Power Automate + Dataverse connector | Power Automate + Office Scripts (M365 Business Std+) | Power Automate + Dataverse connector | Dataverse / Dynamics 365 license only | Power Automate (standard connectors) |
| Payload Limit | ~2 MB JSON from app | ~2 MB JSON from app | No payload — only filter params sent | No payload — URL only | ~2 MB CSV string from app |
| Best For | Small datasets, beginners getting started | Medium datasets needing polished .xlsx output | Large datasets (10K+ rows) | Quick wins with minimal effort | Simple exports with minimal flow complexity |
Which Method Should You Use?
Here’s a quick decision guide:
- Small dataset + exact filters? → Method 5 (CSV Concat) for simplicity
- Need
.xlsxwith nice formatting? → Method 2 (Office Scripts) - Large dataset (10K+ rows)? → Method 3 (OData in Flow)
- Minimal effort, no Power Automate? → Method 4 (Launch View URL)
- Getting started / most tutorials follow this? → Method 1 (Collection + Loop)
Delegation Warning
For Methods 1, 2, and 5, always remember:
- Set your delegation limit to the max (2,000) under Settings → General → Data row limit
- If your filtered data might exceed 2,000 rows, use Method 3
- Show a warning to your users:
If(
    CountRows(colExportData) >= 2000,
    Notify(
        "Warning: Only the first 2,000 records are included.",
        NotificationType.Warning
    )
)
Found this helpful? Share it with your Power Platform community! 🚀
Comments
No sign-in required — just leave your name and comment!